

Creating a roadmap
The Roadmap can be set by the Owner or Editor for the board. Viewers will not be able to create new views, configure the View settings, or add key dates.
There is a default roadmap for portfolios, which includes projects, and another for projects, which includes up to three levels of sub-projects and milestones. You can create up to three additional custom roadmaps for each portfolio or project.
By default, the bar colors are set to the Phase of the project, and the progress (fill) is applied based on Project % completion. However, you can configure different properties to be used for these.
Note that the default bar color must be set for the Phase value in Settings > Configuration > Projects > field values by your Clarizen administrator.
To create a new roadmap:
- Click the Roadmap tab > New.
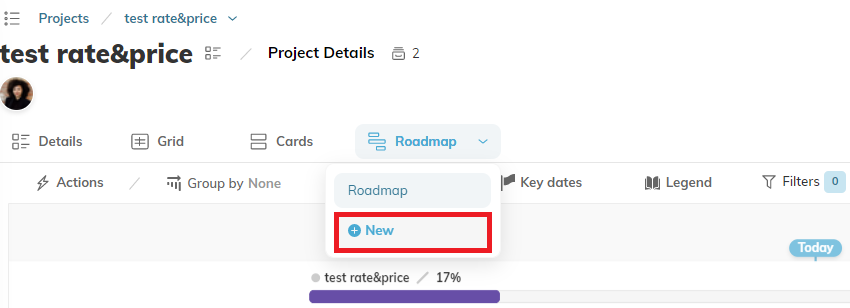
- In the Create Roadmap dialog, do the following:
- Enter a name for the roadmap.
- (Optional). Select the property to group the data by in the roadmap by default. You can group by any standard or custom field of Picklist and Reference to Object types.
The roadmap is created as follows:
- The scale of the roadmap is automatically based on the start date and end date of the program or projects.
- If there are no project values for the property the data is being grouped by, the swimlane is hidden.
- When you add or remove projects, the roadmap is updated automatically. You can also refresh the roadmap manually with the Refresh action in the three-dot menu.
Configuring a roadmap
You can change the roadmap name, the group by property, and which properties you want to use for the bar color and fill. You can also add a duration bar, milestones, percentage value and a color-coded dot that represents a project property such as the schedule status, importance, or geographical region.
- Click Actions > Roadmap settings.
- Specify the name and group by property.
-
Under the Project Appearance, you can select settings for the following:
-
To configure the project bar:
- Enable the Project bar option to display the settings.
- In the Color list, select the phase to be use for the color of the project bar.
- In the Fill list, select the field whose progress is displayed by the project bar.
- To display the baseline or planned duration of the project:
- Enable the Duration Comparison option.
- Select Baseline Duration or Planned Duration.
- To display a duration bar under the project bar for comparison:
- Enable the Duration comparison option.
- Select Baseline Duration or Planned Duration.
- To display milestones:
- Enable the Milestones option.
- Select the phase whose color to use for the milestone.
- To display a dot that is color-coded by project property:
- Enable the Dot Indication option.
- Select the project property.
- To display a percentage value beside the project name:
- Enable the Additional Text Info option.
- Select the percentage field whose value to use.
- Click Save.
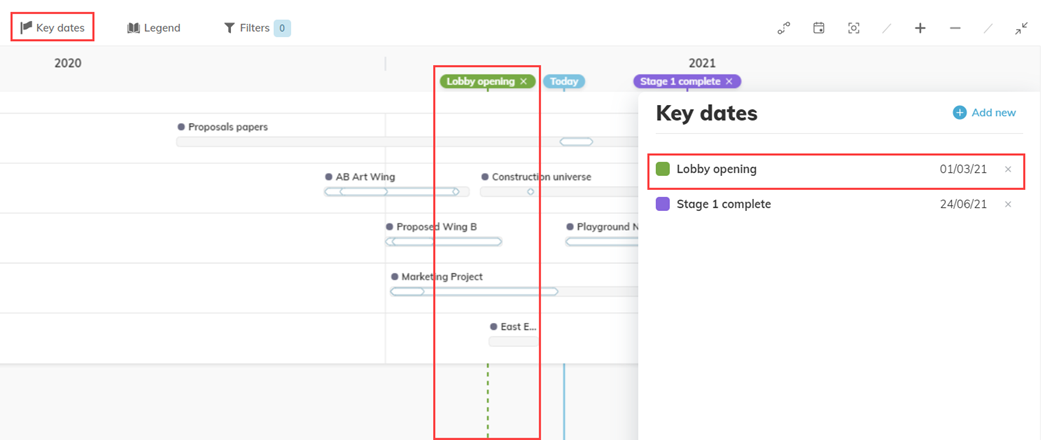
Adding key dates
You can add key dates to the timeline to mark important dates. These can be dates that are relevant to all projects and sub-projects throughout the timeline represented in the roadmap.
- In the roadmap menu bar, click Key dates.
- In the Key dates panel, click Add new.
- Enter a name for the key date.
- Click Select date to enter the date.
- To save the key date, click the check mark
 .
. - To cancel the key date, click the
 .
.
Comments