
Introduction
The Mixed chart type allows you to use different display styles in a single chart, including new types and combinations such as Area, Line/Bar, Stacked Area and Percent Stacked charts.
Mixed charts are also available in Slide Publisher.
Benefits
- Expand the variety of display styles available in Reports, Dashboards and Views
- Differentiate between different types of data in a single chart, for example, Resource Capacity vs. Assignment vs. Actual Effort
How it Works
- When you create a chart, select the Mixed option.
- Define parameters such as x- and y-axis.
- For a single-dimension chart, select a Display Type: Area, Area Smooth, Line, or Line Smooth.
For a multi-line or multi-dimensional chart:- Select the Chart Type: Standard, Stacked, or Stacked Percent.
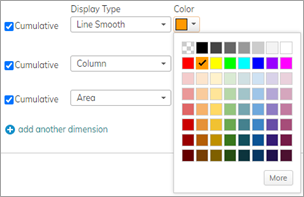
- Select a Display Type: Area, Area Smooth, Bar, Column, Line, or Line Smooth. Multi-dimensional charts allow different settings for each grouping, along with the Cumulative option if needed.
- For multi-dimensional grouping, you can select the color of the Display Type.
Notes:- Selecting the Bar Display Type in one or more multi-dimensional groupings overrides other selections and creates a Bar chart. In such cases, the X-axis and Y-axis are switched.
- When mixing Column groupings with one or more Bar groupings, the Columns will be overridden with additional Bar groupings that appear in front or behind of the Bar-defined groupings.
- Save your chart.
Examples
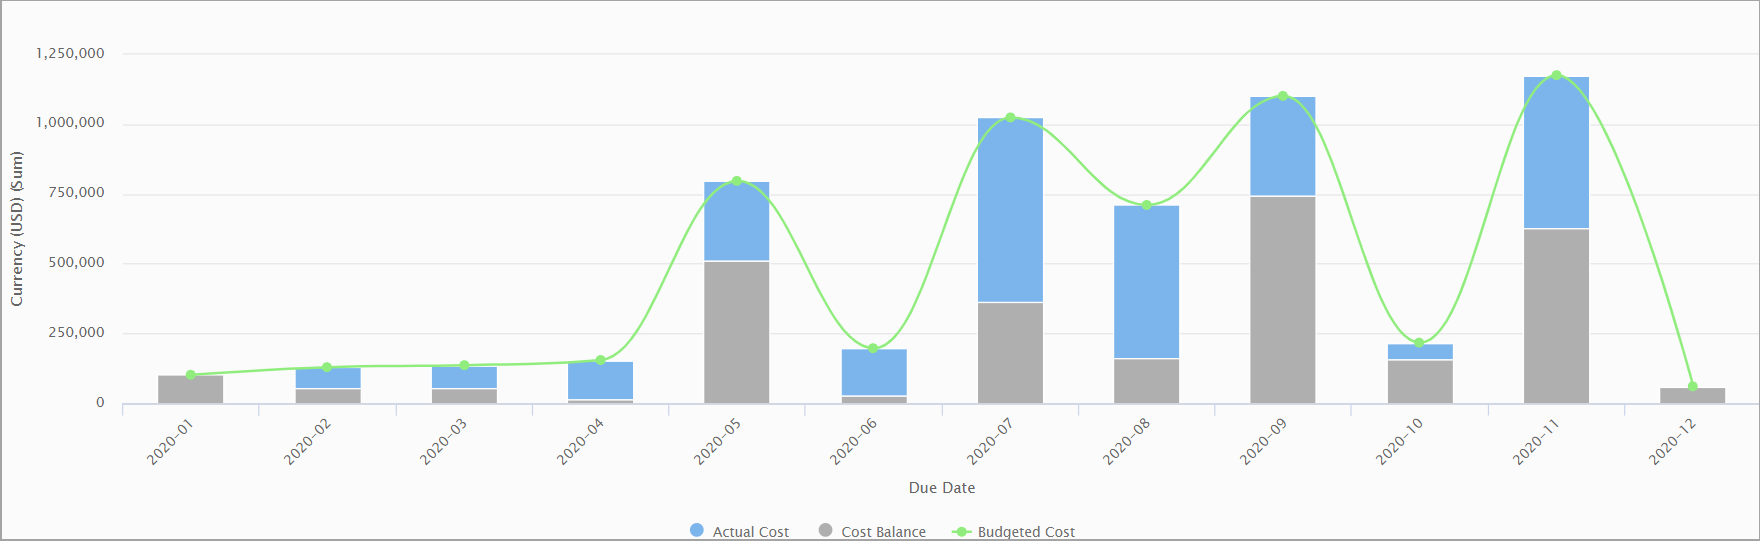
Multi-dimensional smooth line and stacked column
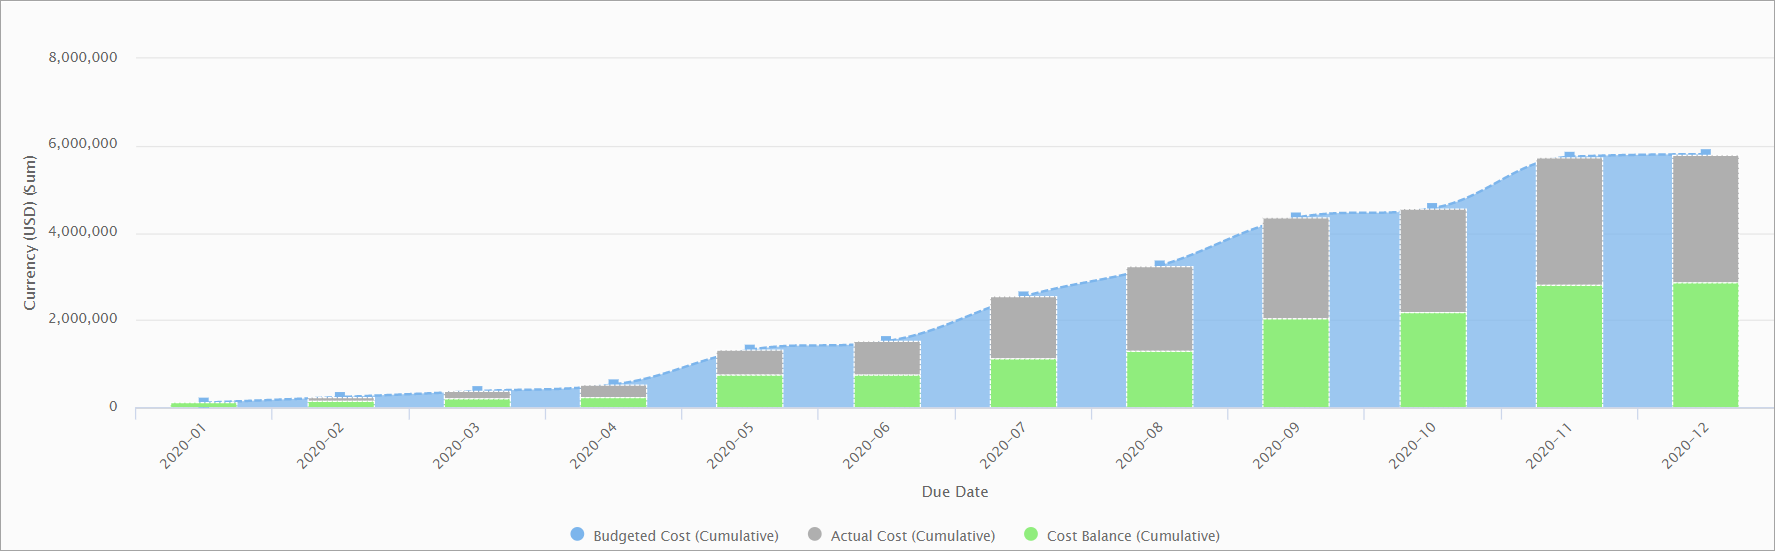
Mufti-series, stacked with cumulative area smooth and columns
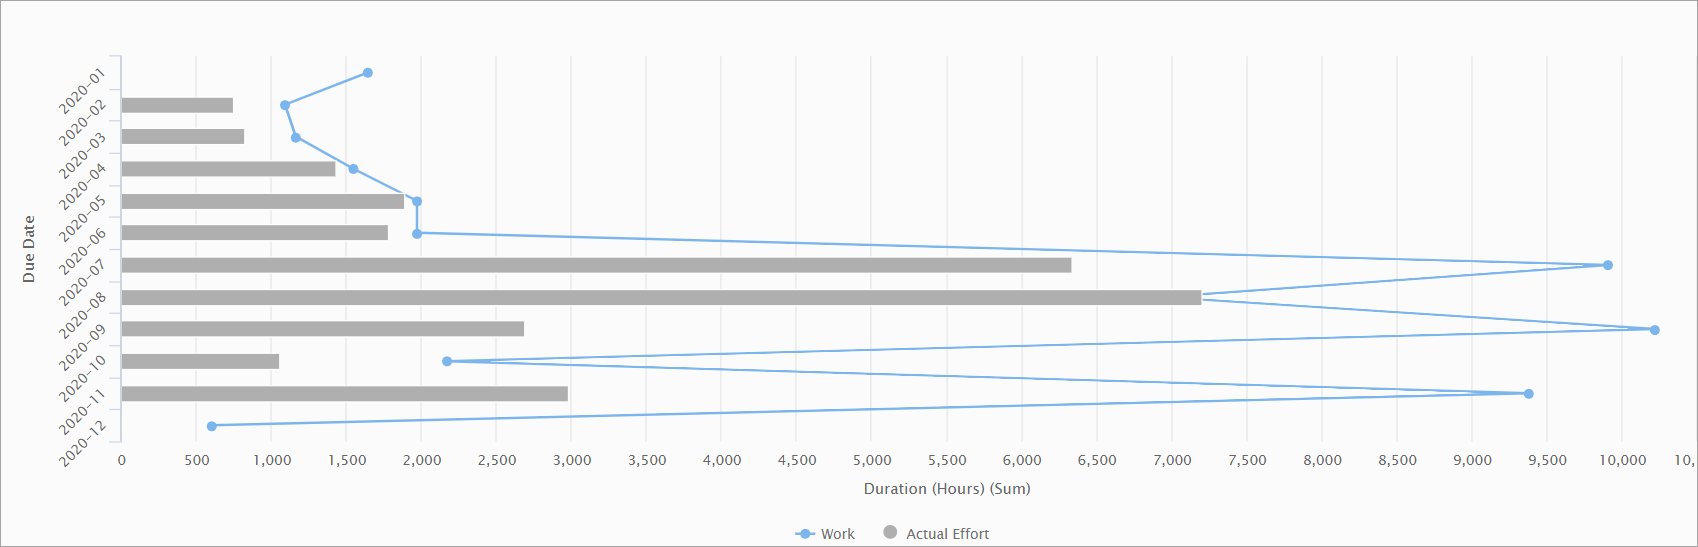
Multi-dimensional line bar
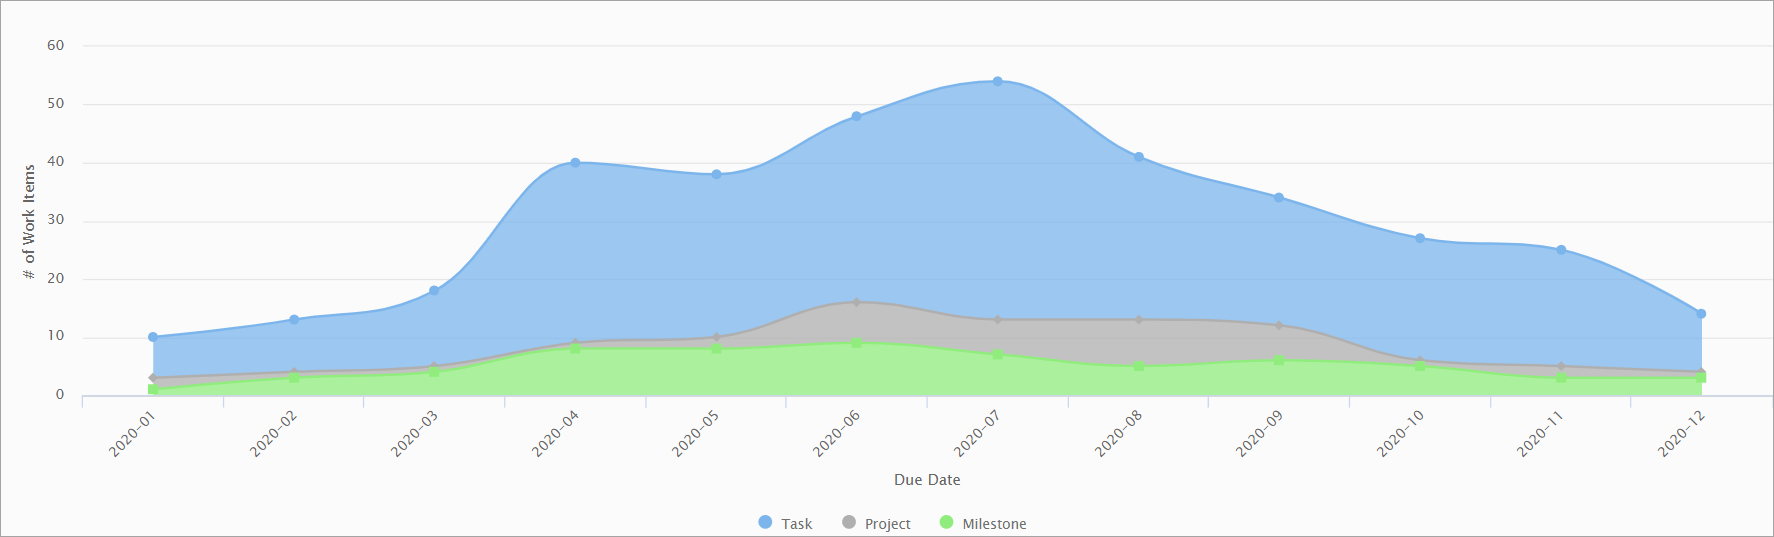
Multi-area smooth stacked
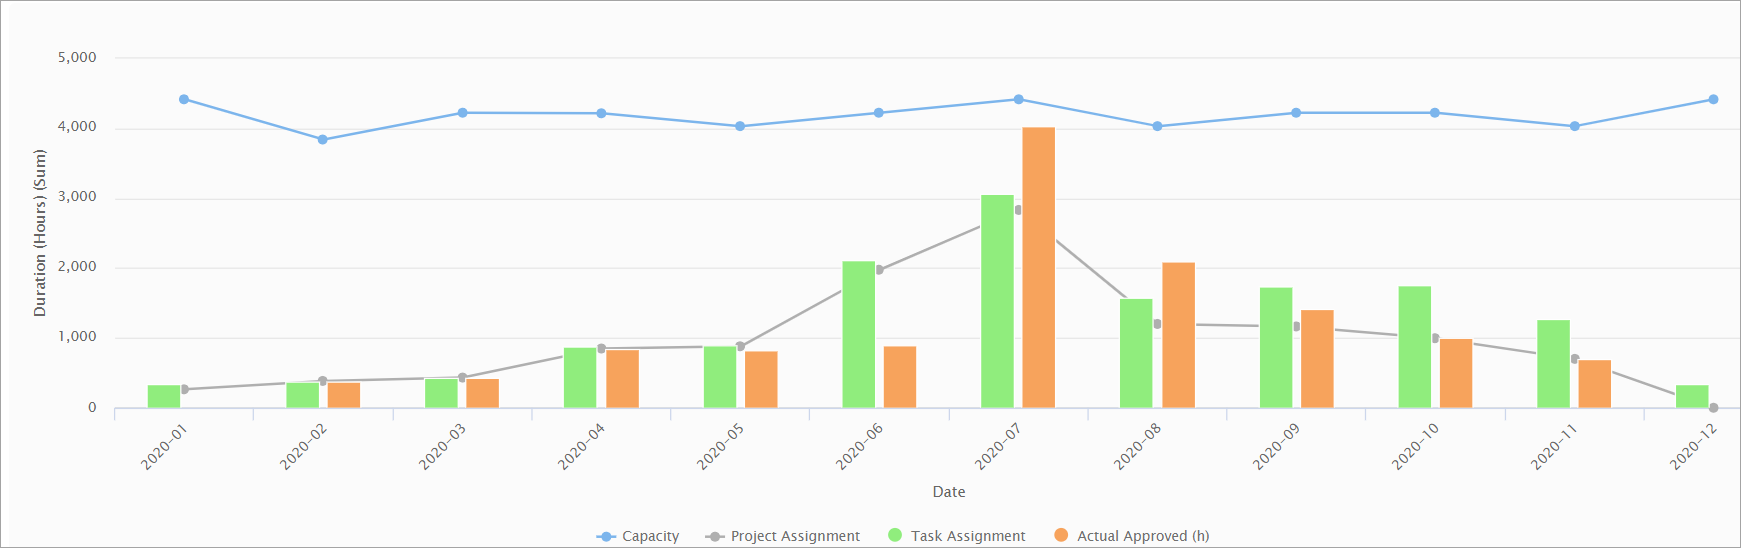
Mixed multi-series and multi-dimensional time-phased
Comments