
Hello Al,
Could you please try using the Bar Chart instead of the Horizontal Bar Chart - it should be able to accommodate more results. Thank You!
Comment actions

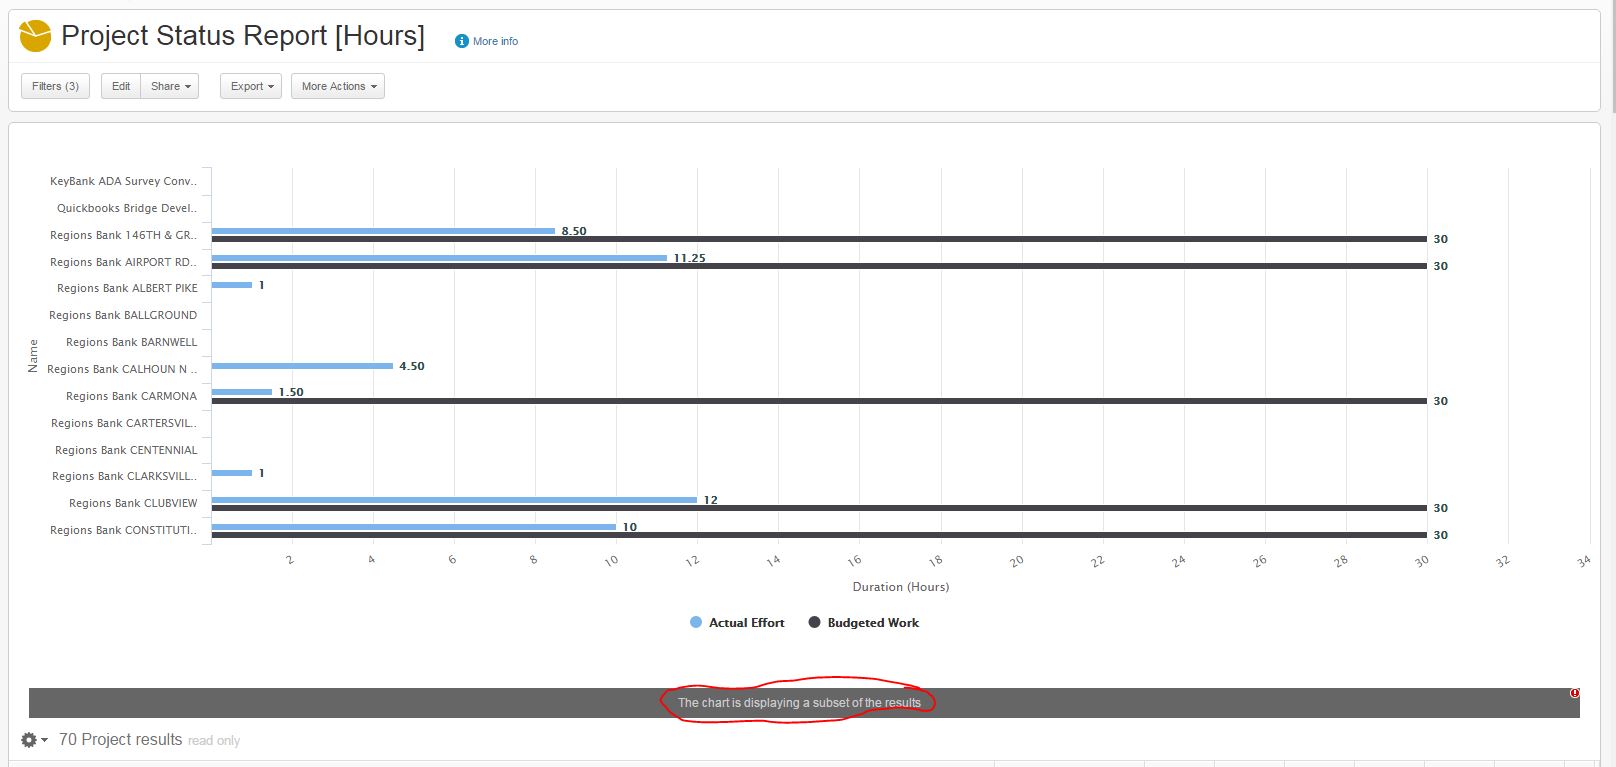
Hi - I've created a simple report to help PMs track the progress/status of their projects at our (relatively small) architecture firm. My issue is that is only displays a "subset of the results" in the chart. Anybody know how to get this to show all projects I'm filtering to? (instead of just 14) I'll try to attach a screenshot here:
Please sign in to leave a comment.
Hello Al,
Could you please try using the Bar Chart instead of the Horizontal Bar Chart - it should be able to accommodate more results. Thank You!

Hello,
This is a limitation of the chart. Only 500 items can be shown on the chart. This limitation is in place to avoid performance issues.

This really should be an option / adjustable parameter or perhaps ability to override in reporting module, as it sort of defeats the purpose of generating a chart within a report if the results cannot be displayed, even with some sort of exception. I too have this problem and have found that at least for the time being (until my results finally exceed even the work around) I am able to zoom out in Chrome and the full set of results shows up.
In other words, if there are limitations in place (even for performance considerations) there should be some method of exception handling available if the user or organization accepts whatever the negative consequences of an over ride / exception happen to be (rather than decided unilaterally to limit functionality).