
This is also a feature many of our users are requesting - This post is flagged as 'Answered' but I don't see the answer - Is there a solution for this?
Comment actions
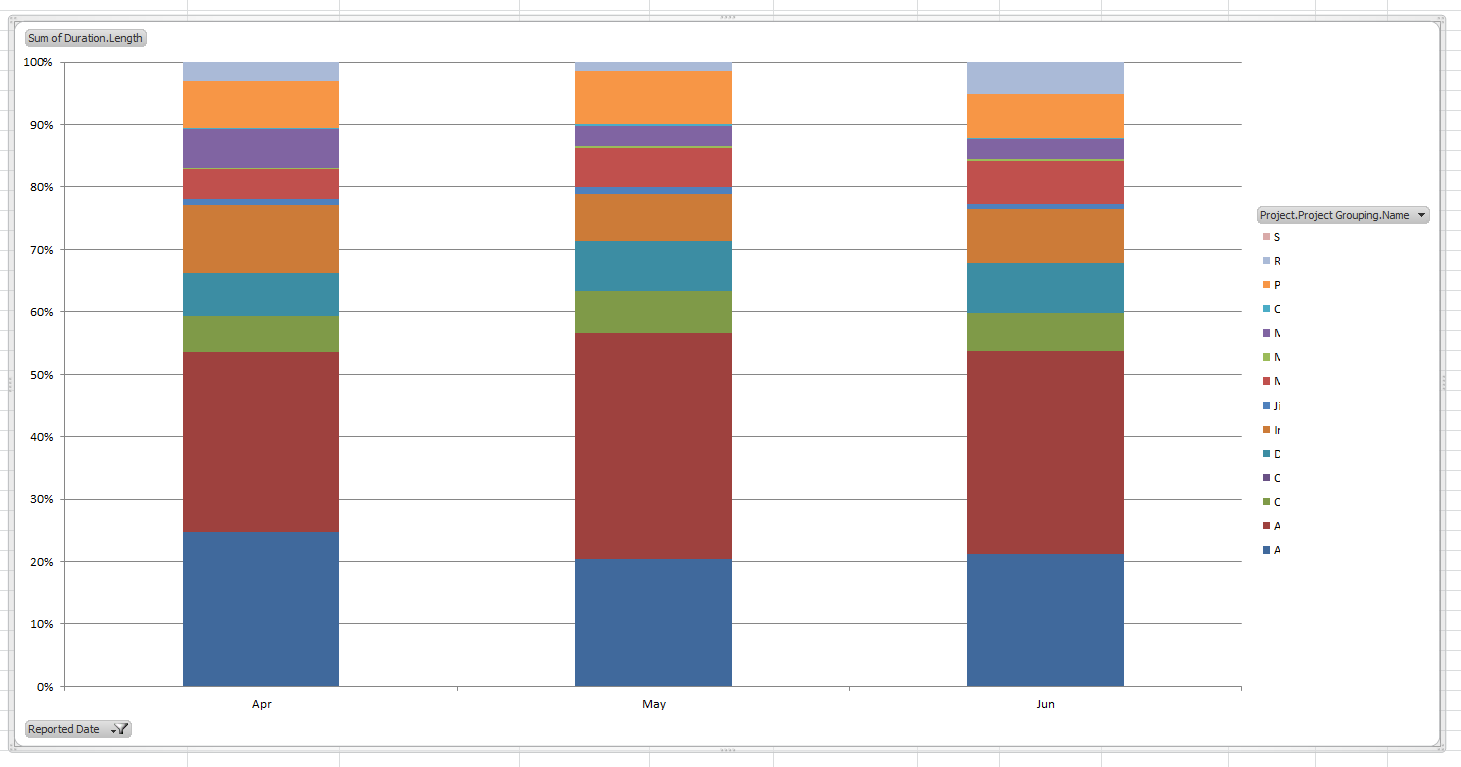
I would love to see the option for a 100% stacked bar chart in the reporting module.
See here is an extract from the Timesheet data using the Excel plugin.
We use this to view our utilisation across the business changing over the months. It would be great to see this in a report so that we can include it on a KPI dashboard. Note this uses Percentage of Duration and not just Percentage of Number of Timesheets.
Thanks
Please sign in to leave a comment.
This is also a feature many of our users are requesting - This post is flagged as 'Answered' but I don't see the answer - Is there a solution for this?