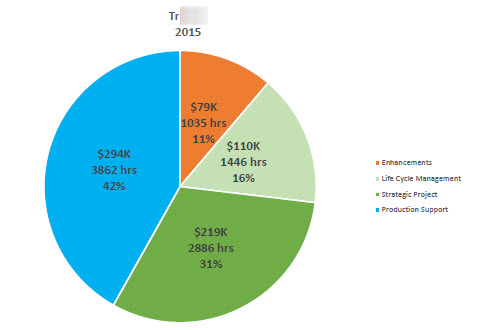
I'd like an update to the pie chart graph for when using it with Timesheets. Currently it only has the options of # of Timesheets and % of Timesheets which isn't too much use.
It would be nice to have it as a percentage of a Sum on a column. For example, I'd like to be able to find out the percentage of time a user spends on projects, and not just the percentage of timesheets created against a project.
Currently, if there are 9 timesheets of 0.5 hours against project A and 1 timesheet of 1d against project. It will suggest that 90% of time will be against Project A and only 10% of time against Project B when actually more time is against Project B than Project A.


