Seems on track to me, but I must say my organization is not using the Gantt as much anymore.
Post
FollowPlease sign in to leave a comment.
8 comments
Date
Votes
Hi Guy,
Can you share why you think it seems 'on track'?
Why is your organization not using the Gantt anymore?
Thanks,
Arnon
I think the answer is more complicated than a single assessment of on or off track.
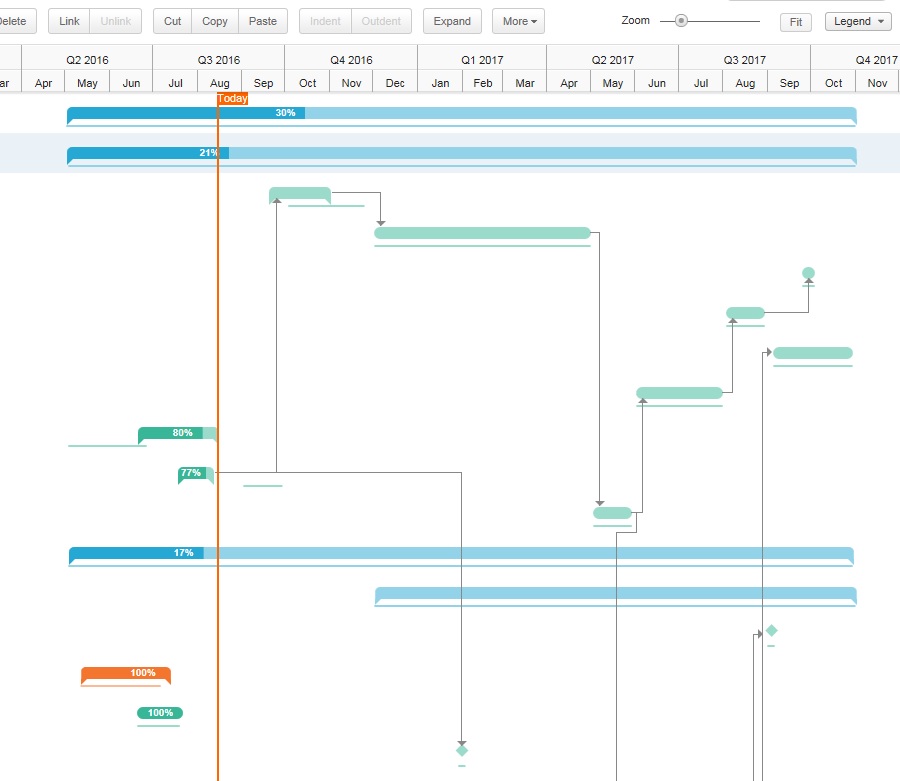
Overall, the total amount of effort to complete vs the overall timeline is good; the project is 30% complete for total effort required (or currently estimated to be required), and on the calendar, only about 23% of the days have lapsed:

However, 2 tasks have failed to be completed whilst they are scheduled to be completed before now:

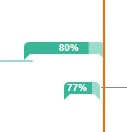
Furthermore, if the resource(s) assigned to the short task which is only 77% complete is going on vacation or leaving the project, this is a big problem because the a dependent task is scheduled to begin next month.
Overall, it does not appear that any task on the schedule presented is ahead of schedule, and some tasks are behind schedule. (Possibly some activities below the screen shot can provide more insight.)
No chart or component of the project exists in a vacuum and this (or any Gantt) cannot be used as a single/sole source of assessment. It's a tool and is best utilized when all users understand the capabilities and limitations.
Hi Matt,
Excellent answers, all your points are valid!
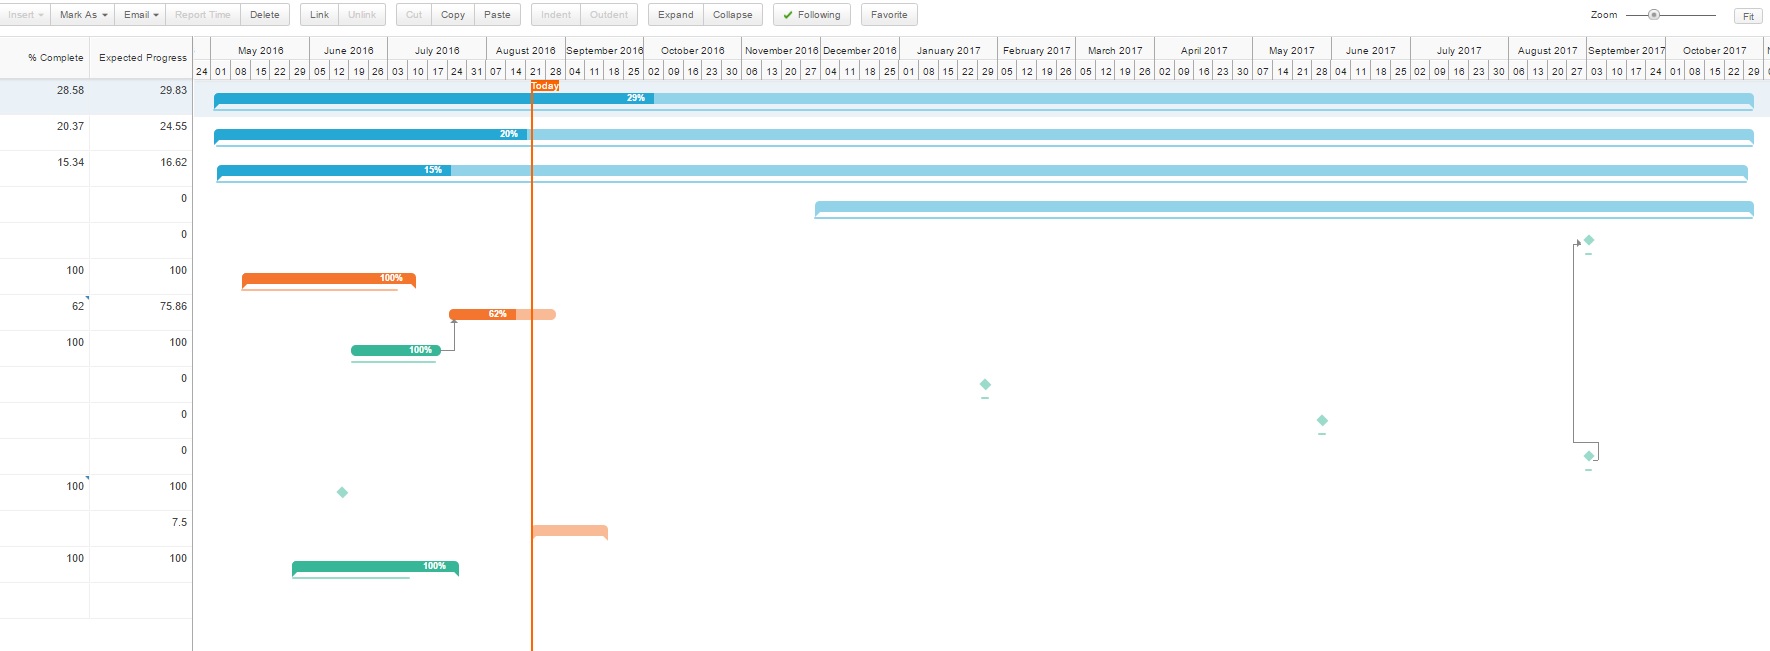
Now, I'll throw in the '% Complete' and 'Expected Progress' columns.....
Are you now able to say whether the project is Behind, On, or Ahead of schedule?
Thanks,
Arnon
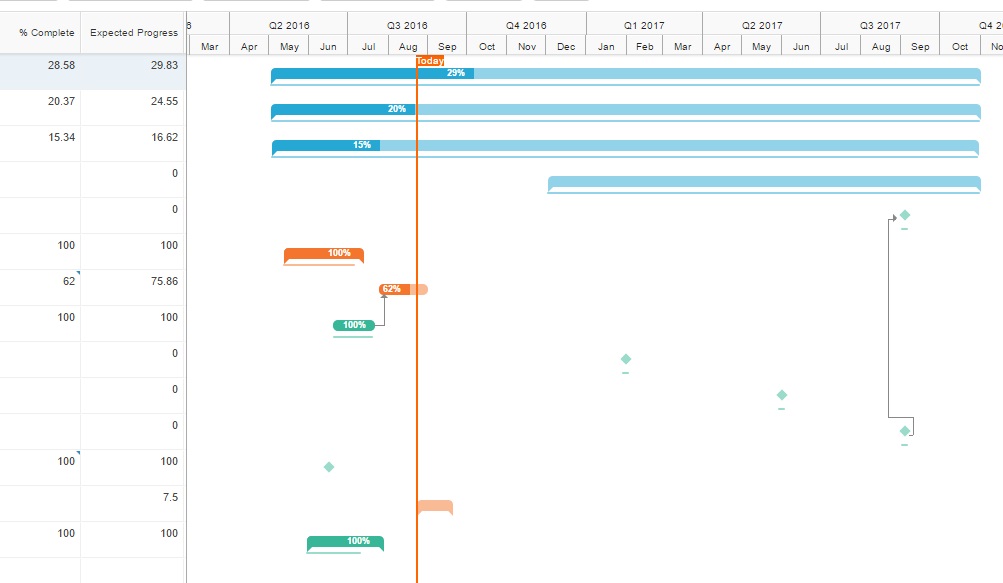
He're the same screen shot, with a larger zoom:

I'd say: overall, you are slightly behind schedule:

28.58% complete vs. expected progress of 29.83%.
Exactly Matt !!!
The project is slightly behind schedule because 28.58% complete vs. expected progress of 29.83%.
But if you look at the Gantt you may be miss-lead to believe that the project is ahead of schedule because the Dark Blue progress indicator is in mid October, while the Today flag is in Mid August.
The Gantt chart progress indicator suggests the project is two months ahead of schedule.
If I am slightly behind schedule, then the progress indicator should show slightly left of Today.
The correct calculation for determining the position of the progress bar should be Today X ('% Complete' / 'Expected Progress).
Currently Clarizen Gantt simply indicates '% Complete', regardless of the time axis and regardless of expected progress.
I think the Gantt chart should be modified/improved to show actual progress in relation to expected progress and according to the time scale.
Do you think I am right?
Thanks,
Arnon
It's indeed a bit confusing
