Post
Follow
Reporting Module Enhancement: Add functionality to restrict axes to some subset.
Summary:
Add the ability to set domain/ranges in the charts.
Use Case:
If you have tasks that record impact events on some set of groups.
The set of groups are in a multi-select picklist.
Sometimes a task can affect more than one group - that is why you have a multi-select pick list.
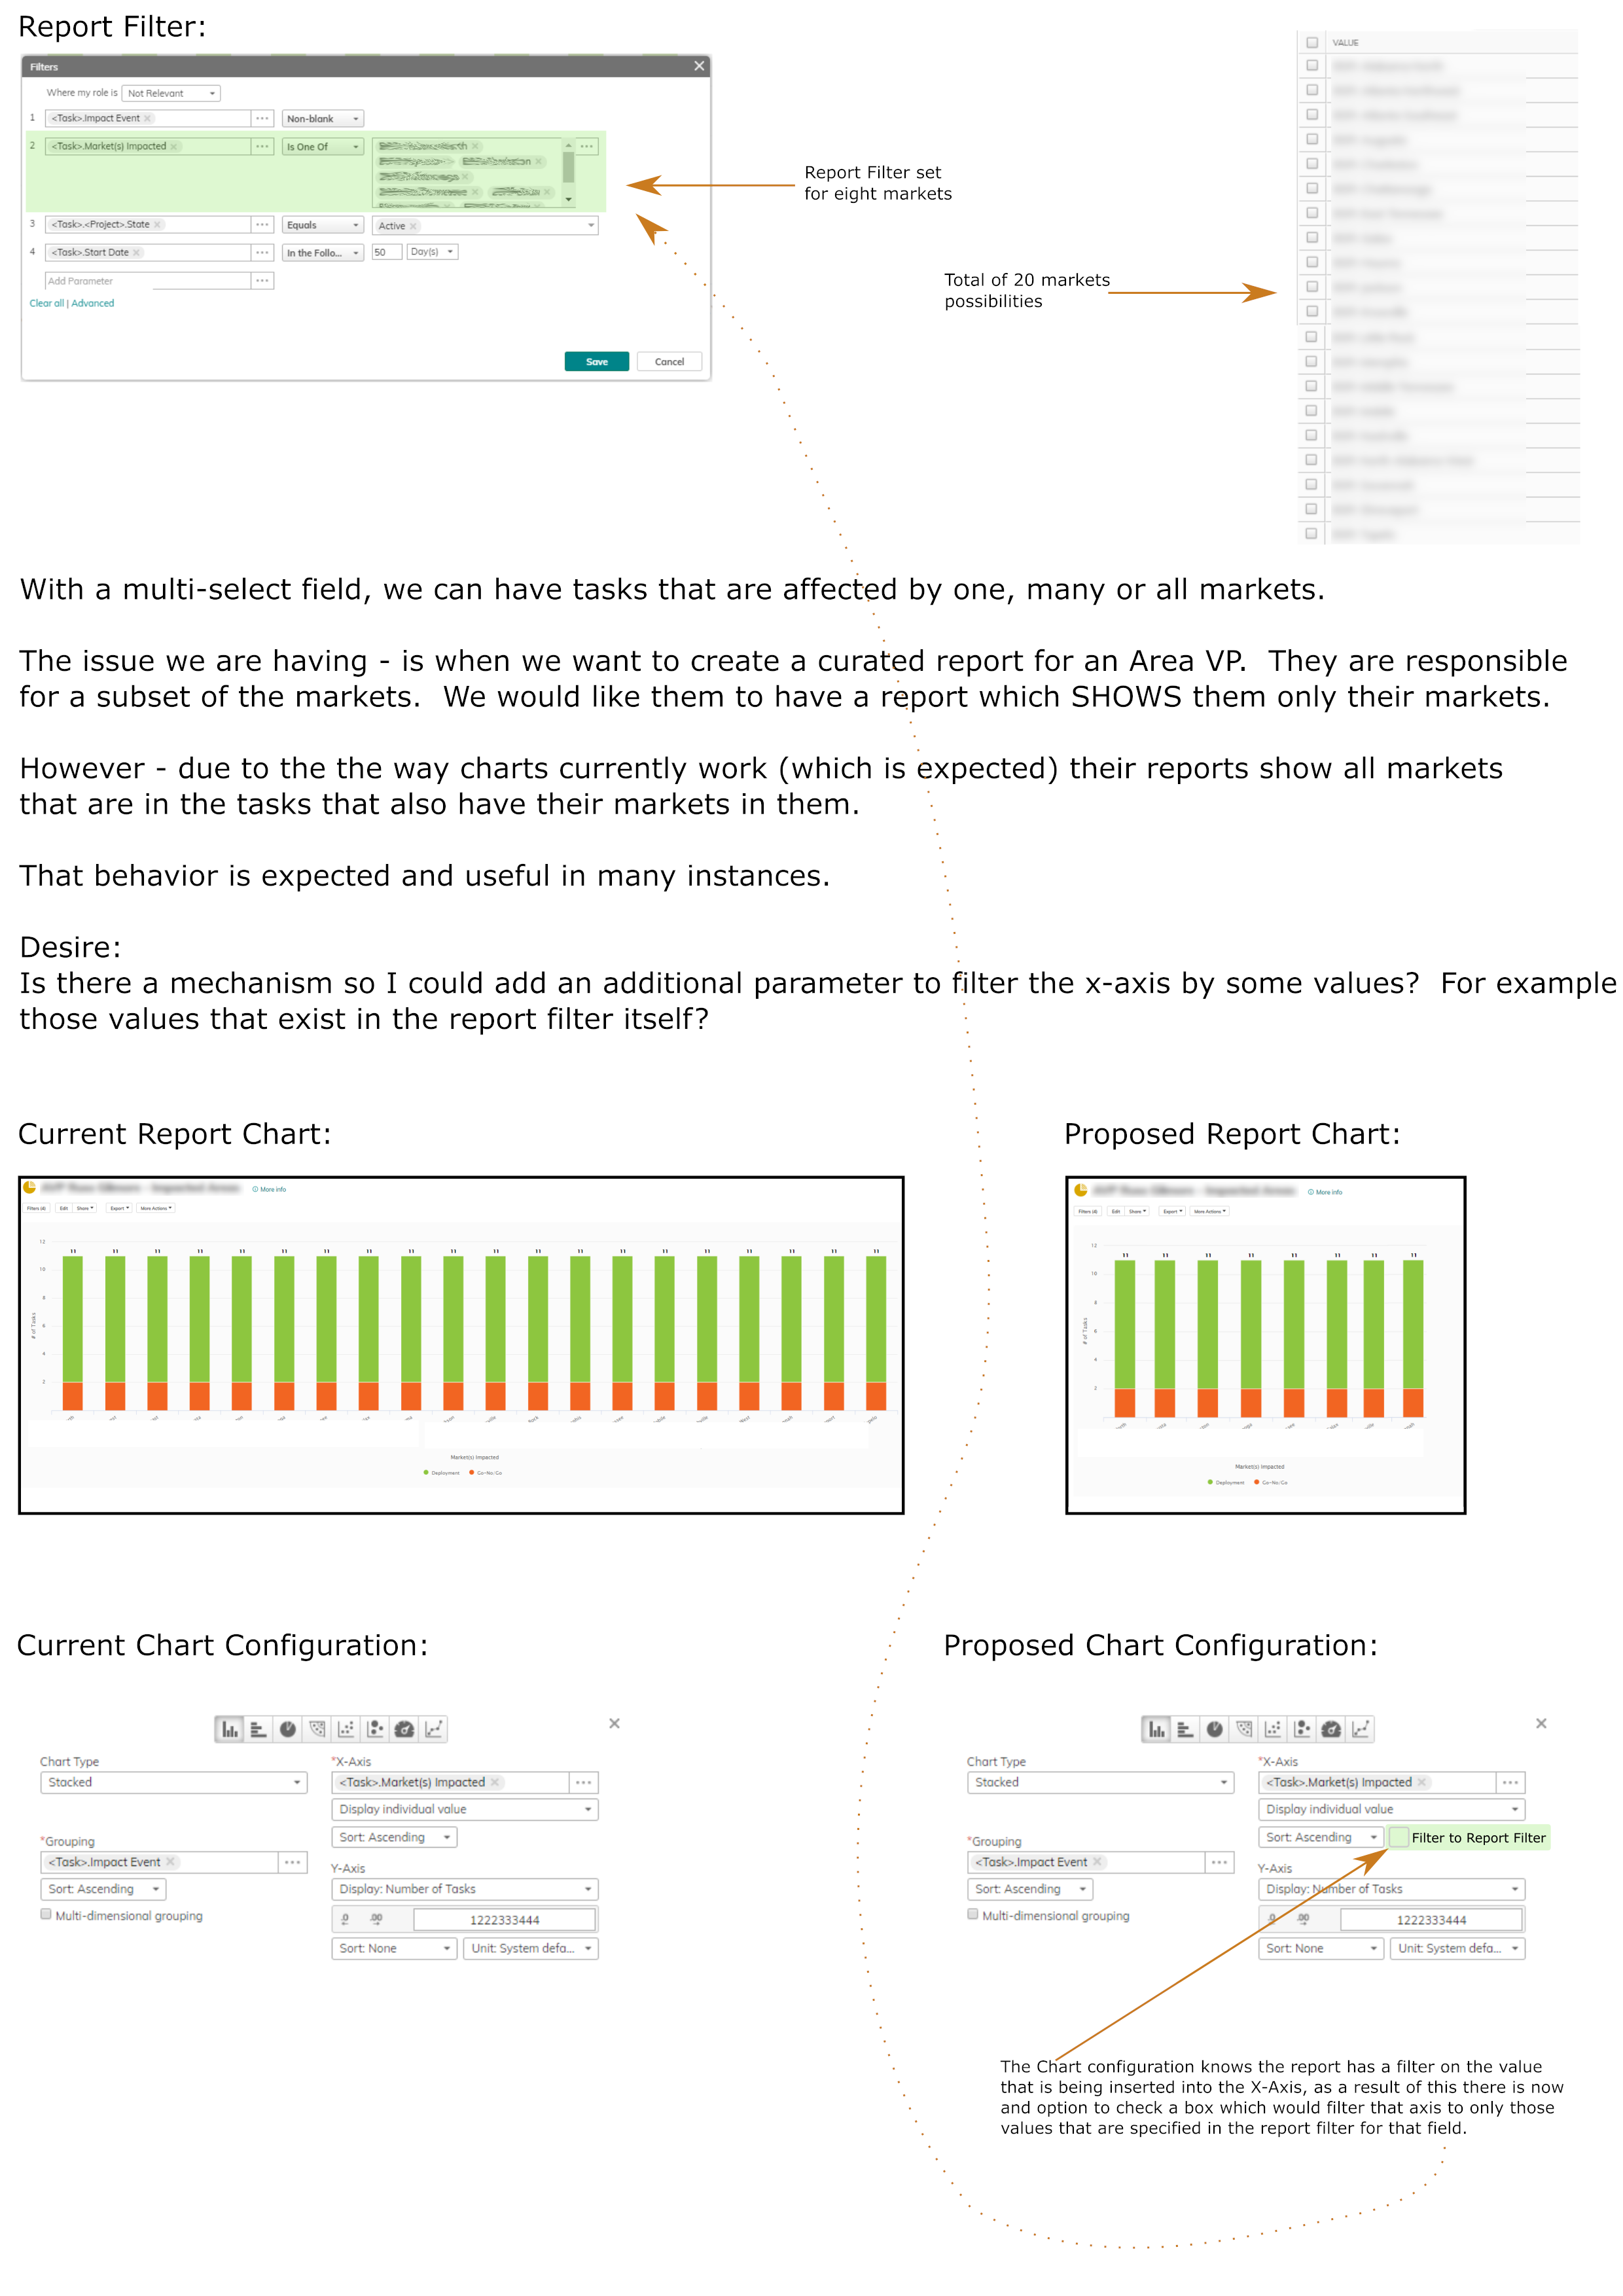
The problem comes when you want to build a report on that and represent it graphically. Lets say you want to have a graph that only shows certain affected areas, so you filter the report to those areas - but by the nature of the setup, the plot will also include the other areas that are affected by those tasks.
In many circumstances you might want this - but sometimes you would just want the plot to have on its axis only those areas you are filtering by. (so the end audience as a more focused view.
Here is a mockup of a possible solution:
Please sign in to leave a comment.