
Dashboards consolidate views from multiple reports.
This section describes:
To learn about sharing, related panels (discussions and emails), and permissions, see Getting Started with Reports.
Accessing the Dashboard Module
To access the Dashboard view:
- Open the main navigation panel.
- Select Dashboard.
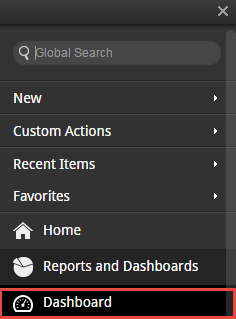
- The last dashboard viewed is opened.
If no dashboards are available, the Reports & Dashboards main view will open instead.
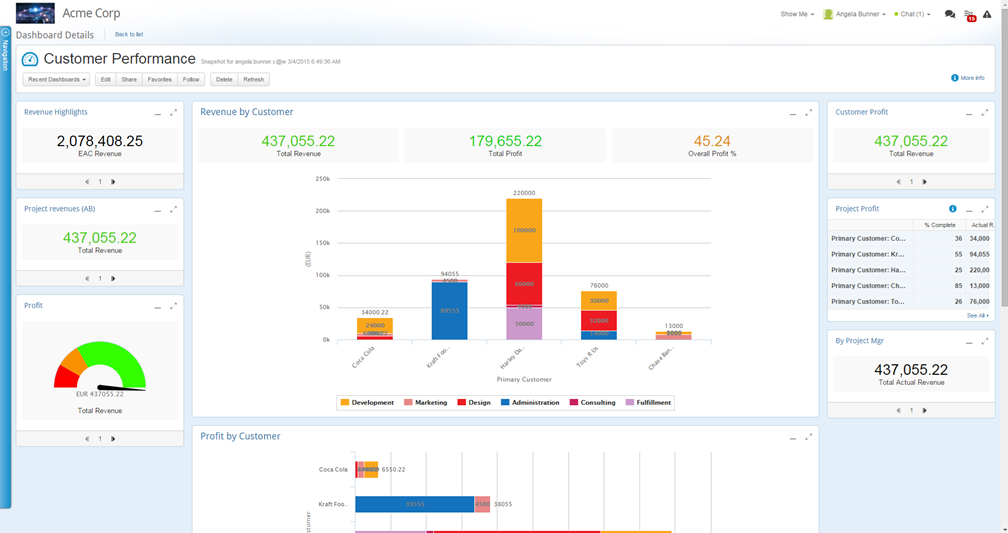
Creating a New Dashboard
Dashboards display data from multiple reports.
Create custom-made dashboards from scratch or based on an existing dashboard.
To create a dashboard:
- From the main navigation menu click + > Dashboard.
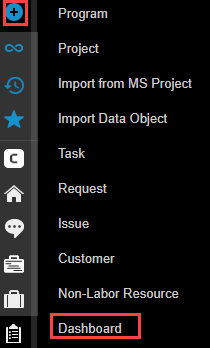
Alternatively in the Reports module, click New Dashboard in the ribbon.
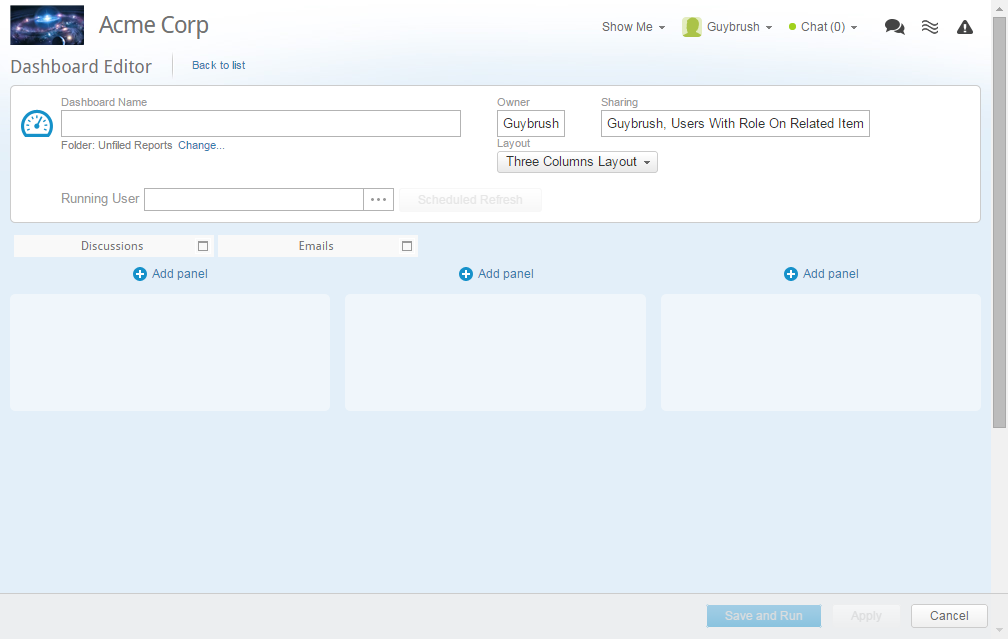
- In the Dashboard Name field, enter a name for the new dashboard.
By default the folder in which the dashboard is saved is the folder in which you are in. To change the folder in which the report is saved, click Change... - Set the sharing permission level.
Note: Users who have access to the folder are inherited with permissions.- Click Permissions.
- Click

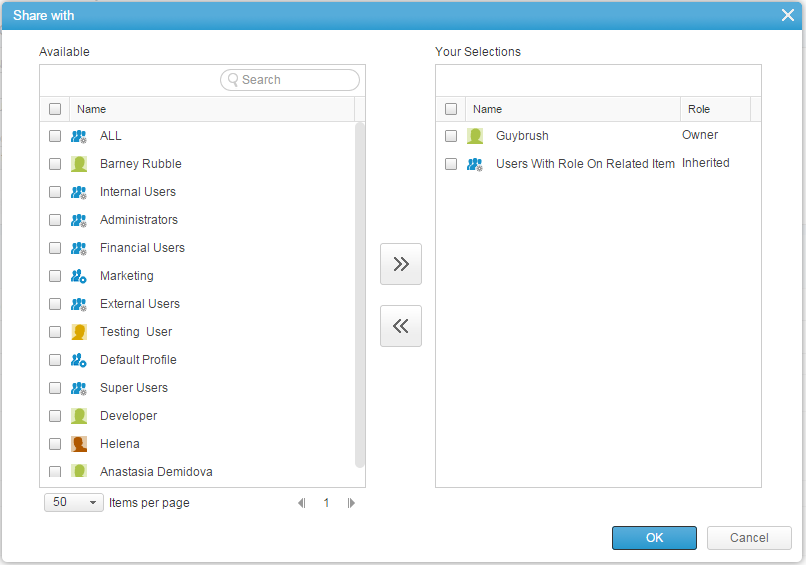
- Select specific users, user groups, profiles, and special groups (such as super user, administrators, etc.).
Tip: Double-click to add or remove list items. - Set the Role (Viewer or Editor) for each of the selected entities.
- Admins can also:
- Set the Running User - The dashboard's Running User determines under which user’s permissions the reports within the dashboard will run, and thereby affect the results of the dashboard. By default it is set to the current user, meaning that each user that runs a dashboard will see only the data they have permissions to view.
- Once the Running User is set, the admin can click Scheduled Refresh to:
- Disable manual refreshing of the dashboard, ensuring that data of the past refresh remains intact.
- Schedule reports to share via discussion posts or email, and optionally save all generated reports as snapshots for future analysis and comparison purposes. The procedure is the same as for reports. Click here to learn more.
- In the Dashboard scheduler
- Click Save.
- Define the dashboard Layout, select between one, two or three columns.
- In each column, add reports:
- Enter a title in the Panel Name field. This field will be automatically populated with the selected report’s name if not manually set.
-
Define which report to show in the Report to display field. If the report has multiple tabs then you will be prompted to select the relevant pivot tab.
- Click Filters to add, remove or modify set filters.
-
In the Style field select the report element(s) to display:
-
In wide columns, you can choose to see the highlight (where applicable) AND either the chart or the table.
-
In narrow columns, you can choose to see either the highlights, chart, or table.
When selecting Table, you can choose which fields to view (fields available are only those already selected in the report itself).
-
- Click Columns to select which columns to include from the report.
-
- Click Add panel to add a report to the column.
- Click Apply to Save the report created keeping it open for further editing.
- Click Save and Run to Save the report created and run it.
To learn about sharing, related panels (discussions and emails), and permissions, see Getting Started with Reports.
Working with Dashboard Filters
Apply filters on dashboards. In the dashboard's view and edit modes, you can now select the filter values for panels (reports) that include run-time filters.
To learn more, click here.
Comments