
This would be a feature request.
Comment actions
Is there a way to plot multiple data columns onto Line / Bar Charts?
I'm trying to produce a report that looks like the following:
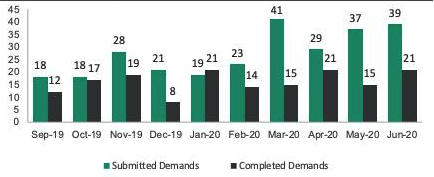
And I have 2 date fields in the Object that I want plot (Submission Date & Completed Date), but you can only pick a single field / data set on the X Axis
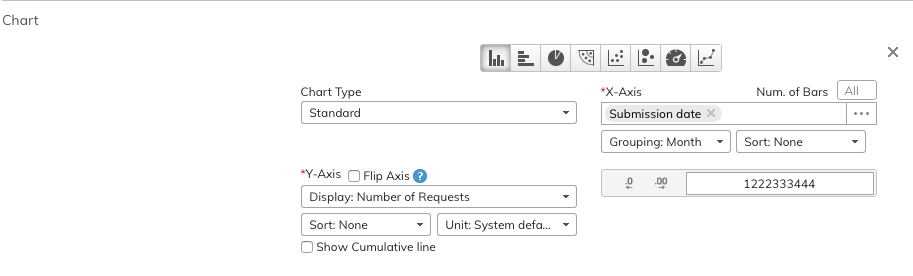
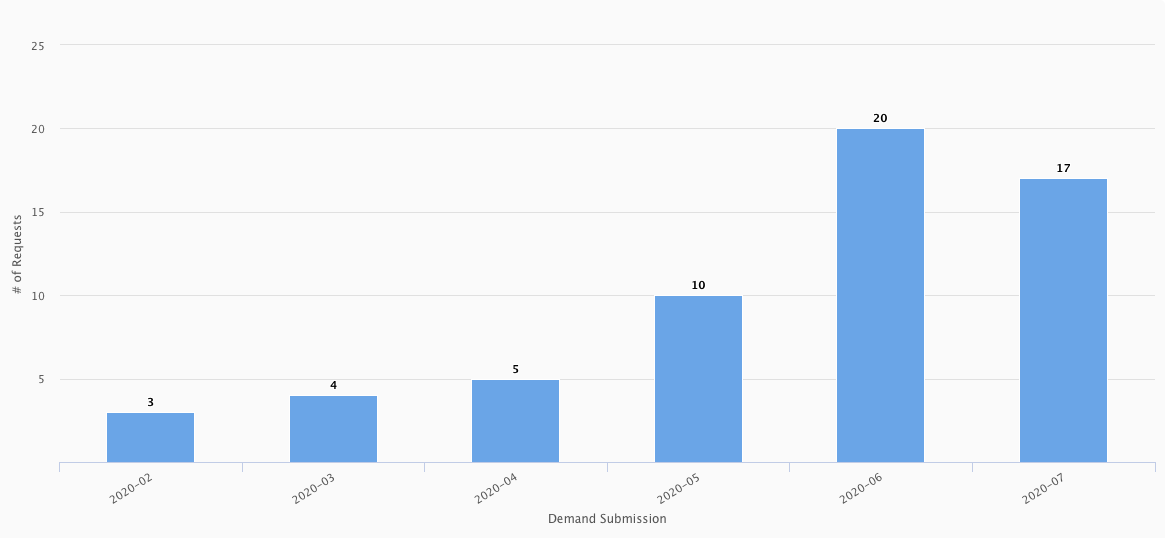
Hoping I'm just missing something obvious....
Please sign in to leave a comment.
This would be a feature request.
Can you please move into the share your ideas and enhancements section please, and I'll forward to the CSM to raise as an enhancement
All set!